Amundi Dow Jones Industrial Average UCITS ETF: A NAV Deep Dive

Table of Contents
Understanding the Amundi Dow Jones Industrial Average UCITS ETF
The Amundi Dow Jones Industrial Average UCITS ETF is a type of exchange-traded fund that falls under the UCITS (Undertakings for Collective Investment in Transferable Securities) regulatory framework. This framework, established within the European Union, ensures a high level of investor protection and standardized regulation for these funds.
- UCITS Regulatory Framework: UCITS ETFs are subject to stringent regulatory requirements concerning risk management, transparency, and investor protection, providing a safer environment for investors.
- Investment Objective: The primary objective of this ETF is to replicate the performance of the Dow Jones Industrial Average as closely as possible. This means aiming for a return that mirrors the index's movements.
- Replication Strategy: The ETF likely employs a full replication strategy, meaning it holds all 30 stocks in the DJIA in the same proportions as the index itself. This minimizes tracking error – the difference between the ETF's performance and the index's performance. While other strategies like optimized replication exist (holding a subset of the index stocks to approximate its performance) they are less common for a major index like the DJIA. The choice of replication strategy greatly impacts the expense ratio and tracking error. A comparison of different expense ratios across different funds tracking the same index is vital for investors looking to maximize returns and minimize costs.
- Expense Ratio: The expense ratio represents the annual cost of owning the ETF, expressed as a percentage of assets under management. A lower expense ratio translates to higher returns for investors. Understanding the expense ratio is a critical component of any expense ratio comparison between similar ETFs.
Deconstructing the Net Asset Value (NAV)
The Net Asset Value (NAV) is the net value of an ETF's assets minus its liabilities, divided by the number of outstanding shares. It represents the intrinsic value of a single ETF share. Understanding NAV calculation is critical for assessing the true value of your investment.
- NAV Calculation: The NAV is calculated daily, typically at the close of the market. This calculation considers the market value of all underlying assets (the 30 stocks in the DJIA), subtracts any liabilities (such as management fees), and then divides by the total number of outstanding shares. This results in the NAV per share.
- Components of NAV: The key components of NAV calculation include:
- Market Value of Underlying Assets: The current market price of each stock in the DJIA, multiplied by the number of shares held by the ETF.
- Liabilities: Expenses such as management fees and other operational costs.
- Other Relevant Factors: Any accrued income (like dividends) or other minor adjustments.
- Frequency of NAV Publication: The NAV is typically published daily, providing investors with an up-to-date assessment of the ETF's value. The exact timing of publication depends on the fund and its custodian bank.
- Impact of Asset Price Changes: Fluctuations in the market prices of the underlying stocks directly impact the ETF's NAV. An increase in the DJIA's value will generally lead to a rise in the ETF's NAV, and vice versa.
Analyzing NAV Trends and Performance
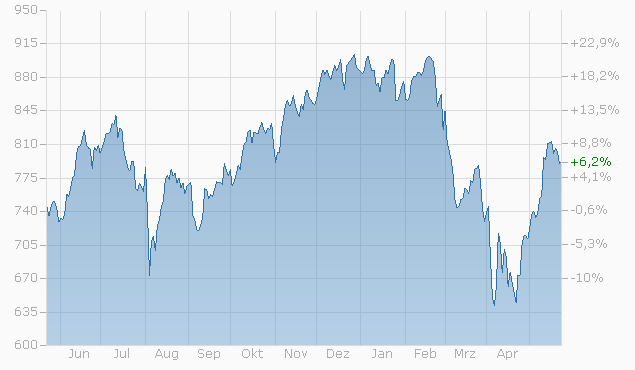
Analyzing historical NAV data is crucial for assessing the Amundi Dow Jones Industrial Average UCITS ETF's performance. (Insert chart/graph showing historical NAV performance here).
- NAV Performance vs. DJIA: Comparing the ETF's NAV performance with the Dow Jones Industrial Average itself helps evaluate the ETF's tracking accuracy. Ideally, the two should move in close alignment. Any significant deviation might indicate a tracking error, which could be due to the fund's replication strategy and management fees.
- Influencing Factors: Several factors can influence NAV fluctuations, including:
- Market Volatility: General market downturns will typically lead to a decrease in the ETF's NAV.
- Currency Fluctuations: If the ETF holds assets denominated in currencies other than the investor's base currency, exchange rate movements can impact the NAV.
- Dividend Distributions: Dividend payments from the underlying stocks reduce the ETF's assets, leading to a slight decrease in the NAV on the ex-dividend date.
- Long-Term vs. Short-Term Analysis: While short-term NAV fluctuations can be influenced by market noise, long-term analysis provides a more accurate assessment of the ETF's overall performance and its ability to track the DJIA. Focus on long-term trends and avoid making impulsive decisions based solely on short-term market volatility.
NAV and Investor Decisions
The NAV plays a pivotal role in investment decision-making, although it shouldn't be the sole factor considered.
- Buy/Sell Signals: While NAV itself isn't a direct buy/sell signal, significant deviations from the market price (premium or discount) can offer insights. A significant discount might present a buying opportunity, while a premium might suggest selling. However, this requires a deep understanding of market dynamics.
- Premium and Discount: The market price of an ETF can deviate from its NAV, resulting in a premium (market price > NAV) or discount (market price < NAV). This is influenced by supply and demand in the market. Understanding these price deviations is crucial for any investment strategy involving ETFs.
- Assessing Overall Value: The NAV provides a crucial element in evaluating the ETF's overall value. Combining this with other factors provides a comprehensive picture.
- Investment Strategy: NAV should be considered in context with your broader investment strategy, risk tolerance, and investment goals. It's just one piece of the puzzle.
Conclusion: Making Informed Decisions with the Amundi Dow Jones Industrial Average UCITS ETF NAV
Understanding the Net Asset Value (NAV) of the Amundi Dow Jones Industrial Average UCITS ETF is paramount for making informed investment decisions. Analyzing NAV trends, comparing it to the DJIA's performance, and considering influencing factors like market volatility and dividend distributions, provide a holistic view of your investment. Remember to always conduct thorough research and consult with a financial advisor before making any investment decisions. Deepen your understanding of the Amundi Dow Jones Industrial Average UCITS ETF and its NAV to make informed investment decisions today! [Link to relevant resources here]
Featured Posts
-
 March 7 2025 Paris Economy Suffers From Luxury Goods Sector Weakness
May 24, 2025
March 7 2025 Paris Economy Suffers From Luxury Goods Sector Weakness
May 24, 2025 -
 Significant Drop In Amsterdam Stock Exchange Aex Index Down Over 4
May 24, 2025
Significant Drop In Amsterdam Stock Exchange Aex Index Down Over 4
May 24, 2025 -
 Amundi Msci All Country World Ucits Etf Usd Acc A Guide To Net Asset Value Nav
May 24, 2025
Amundi Msci All Country World Ucits Etf Usd Acc A Guide To Net Asset Value Nav
May 24, 2025 -
 Ex French Prime Minister Critiques Macrons Policies
May 24, 2025
Ex French Prime Minister Critiques Macrons Policies
May 24, 2025 -
 Amsterdam City Faces Lawsuit Residents Cite Tik Tok Induced Overcrowding At Local Business
May 24, 2025
Amsterdam City Faces Lawsuit Residents Cite Tik Tok Induced Overcrowding At Local Business
May 24, 2025
Latest Posts
-
 Ces Unveiled Europe Innovation Et Technologie A Amsterdam
May 24, 2025
Ces Unveiled Europe Innovation Et Technologie A Amsterdam
May 24, 2025 -
 Retour Du Ces Unveiled A Amsterdam Decouvrez Les Innovations Europeennes
May 24, 2025
Retour Du Ces Unveiled A Amsterdam Decouvrez Les Innovations Europeennes
May 24, 2025 -
 Amsterdam Accueille Le Ces Unveiled Europe Les Technologies De Demain
May 24, 2025
Amsterdam Accueille Le Ces Unveiled Europe Les Technologies De Demain
May 24, 2025 -
 Ces Unveiled Europe Nouveautes Technologiques A Amsterdam
May 24, 2025
Ces Unveiled Europe Nouveautes Technologiques A Amsterdam
May 24, 2025 -
 Ces Unveiled Europe A Amsterdam Un Apercu Des Innovations Technologiques
May 24, 2025
Ces Unveiled Europe A Amsterdam Un Apercu Des Innovations Technologiques
May 24, 2025

