Amundi Dow Jones Industrial Average UCITS ETF Dist: Understanding Net Asset Value (NAV)
")
Table of Contents
What is Net Asset Value (NAV) and How is it Calculated?
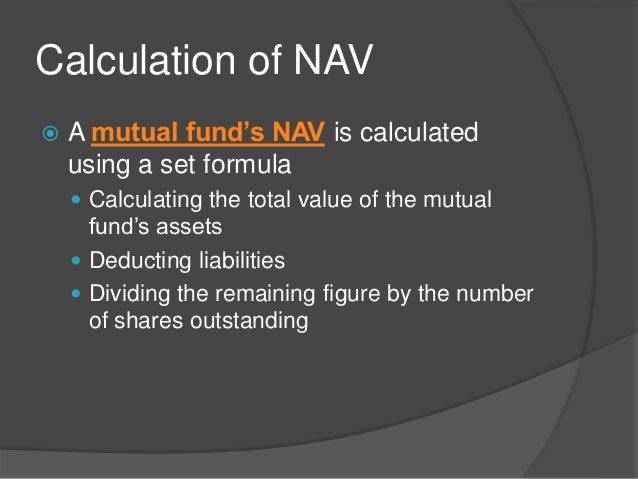
Net Asset Value (NAV) represents the intrinsic value of an ETF's holdings. For the Amundi Dow Jones Industrial Average UCITS ETF Dist, the NAV calculation involves determining the total value of all the assets held within the ETF, subtracting its liabilities, and then dividing that figure by the total number of outstanding shares. Let's break down the components:
- Assets: This includes the market value of all the stocks comprising the Dow Jones Industrial Average that the ETF holds, plus any cash reserves and other assets the fund may possess. The market value fluctuates daily, directly impacting the NAV.
- Liabilities: These are the ETF's outstanding expenses and obligations, such as management fees and other operational costs.
The formula is simple: NAV = (Total Assets - Total Liabilities) / Number of Outstanding Shares
The key difference between NAV and market price lies in their drivers:
- NAV reflects the intrinsic value of the ETF's underlying assets. It's a calculated value based on the actual worth of what the fund owns.
- Market price fluctuates based on supply and demand. It can trade above or below the NAV depending on investor sentiment and trading activity.
Understanding this difference is crucial for making informed investment decisions. A discrepancy between the NAV and market price might present an opportunity, but careful analysis is needed.
How NAV Impacts the Amundi Dow Jones Industrial Average UCITS ETF Dist
The daily NAV calculation, published by the fund manager Amundi, directly impacts the ETF's share price. Because this ETF tracks the Dow Jones Industrial Average, movements in the index directly influence the NAV. When the Dow performs well, the value of the ETF's holdings increases, leading to a higher NAV. Conversely, a decline in the Dow results in a lower NAV.
- Daily NAV calculations are published by the fund manager and are readily available to investors.
- Changes in the Dow Jones Industrial Average directly affect the ETF's NAV, providing a clear link between market performance and your investment.
- Dividend distributions (Dist), a key feature of this ETF, reduce the NAV per share on the ex-dividend date. While you receive the dividend payment, it decreases the fund's overall assets and consequently the NAV.
Accessing and Interpreting the Amundi Dow Jones Industrial Average UCITS ETF Dist NAV
Finding the daily NAV for the Amundi Dow Jones Industrial Average UCITS ETF Dist is straightforward. You can typically access this information through:
- The official Amundi website: This is the primary source for accurate and up-to-date NAV data.
- Financial news websites and platforms: Many reputable financial websites provide real-time or delayed NAV information for various ETFs.
- Your brokerage account: If you hold shares of the ETF, your brokerage account will usually display the current NAV.
Interpreting the NAV data requires comparing it to past performance and current market trends. Consistent monitoring allows you to identify potential investment opportunities and adjust your strategy accordingly.
- Regularly check the fund's website for the most accurate and up-to-date NAV information.
- Compare the NAV to its past performance to gauge trends and potential growth.
- Use NAV as a key indicator to inform your investment decisions and refine your strategies.
NAV vs. Market Price: Understanding the Discrepancy
While the NAV represents the intrinsic value, the market price reflects the forces of supply and demand. Several factors contribute to the difference:
- Bid-ask spread: The difference between the highest price a buyer is willing to pay (bid) and the lowest price a seller is willing to accept (ask) creates a natural discrepancy.
- Market sentiment: Investor optimism or pessimism can drive the market price above or below the NAV, regardless of the underlying asset value.
- Trading volume: High trading volume generally leads to a tighter spread and a market price closer to the NAV. Low volume can exacerbate price discrepancies.
Conclusion: Making Informed Investment Decisions with Amundi Dow Jones Industrial Average UCITS ETF Dist NAV
Understanding the Net Asset Value (NAV) of the Amundi Dow Jones Industrial Average UCITS ETF Dist is paramount for successful investing. We've explored how NAV is calculated, its relationship to the underlying Dow Jones Industrial Average, the impact of dividends, and how to access and interpret this vital information. Regularly monitoring the NAV, alongside market trends, allows you to make more informed decisions and optimize your investment strategy. Mastering the Amundi Dow Jones Industrial Average UCITS ETF Dist's NAV is key to successful investing! Visit the Amundi website [insert link here] for more details and to access the latest NAV data.
Featured Posts
-
 The Importance Of Net Asset Value Nav For Amundi Dow Jones Industrial Average Ucits Etf Investors
May 24, 2025
The Importance Of Net Asset Value Nav For Amundi Dow Jones Industrial Average Ucits Etf Investors
May 24, 2025 -
 Stoxx Europe 600 Ve Dax 40 Endekslerinde Gerileme 16 Nisan 2025 Avrupa Piyasalari Raporu
May 24, 2025
Stoxx Europe 600 Ve Dax 40 Endekslerinde Gerileme 16 Nisan 2025 Avrupa Piyasalari Raporu
May 24, 2025 -
 Secure Your Bbc Radio 1 Big Weekend 2025 Tickets Complete Guide
May 24, 2025
Secure Your Bbc Radio 1 Big Weekend 2025 Tickets Complete Guide
May 24, 2025 -
 Evrovidenie 2025 Chetyre Predskazaniya Konchity Vurst Po Versii Unian
May 24, 2025
Evrovidenie 2025 Chetyre Predskazaniya Konchity Vurst Po Versii Unian
May 24, 2025 -
 Amundi Dow Jones Industrial Average Ucits Etf A Guide To Net Asset Value
May 24, 2025
Amundi Dow Jones Industrial Average Ucits Etf A Guide To Net Asset Value
May 24, 2025
Latest Posts
-
 Amsterdam Stock Market Three Days Of Significant Losses Totaling 11
May 24, 2025
Amsterdam Stock Market Three Days Of Significant Losses Totaling 11
May 24, 2025 -
 Dazi E Mercati L Unione Europea Pronta A Reagire Alla Crisi
May 24, 2025
Dazi E Mercati L Unione Europea Pronta A Reagire Alla Crisi
May 24, 2025 -
 Dutch Stocks Continue Downturn As Trade War With Us Heats Up
May 24, 2025
Dutch Stocks Continue Downturn As Trade War With Us Heats Up
May 24, 2025 -
 Le Borse Crollano A Causa Dei Dazi La Risposta Decisa Della Ue
May 24, 2025
Le Borse Crollano A Causa Dei Dazi La Risposta Decisa Della Ue
May 24, 2025 -
 Guerra Dei Dazi Impatto Sulle Borse Europee E Reazioni Ue
May 24, 2025
Guerra Dei Dazi Impatto Sulle Borse Europee E Reazioni Ue
May 24, 2025

